Before you leave...
Take 20% off your first order
20% off
Enter the code below at checkout to get 20% off your first order
Discover summer reading lists for all ages & interests!
Find Your Next Read

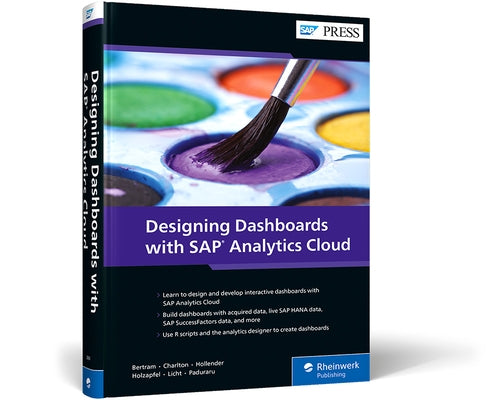
SAP Analytics Cloud is overflowing with visualization options. Charts, tables, drilldowns, geomaps--if you can dream it, you can design and build it. Learn how to create a dashboard for any use case, from acquired data dashboards and responsive mobile dashboards to HR dashboards using SAP SuccessFactors data. Follow step-by-step instructions to structure your data, choose the relevant features, and then implement them. Contains custom-designed dashboards for each chapter!
Highlights include:
1) Dashboard design
2) Live data connections
3) Acquired data dashboards
4) Planning dashboards
5) Responsive mobile dashboards
6) SAP SuccessFactors dashboards
7) Qualtrics dashboards
8) R visualizations
9) Analytics designer
10) SAP Digital Boardroom
Thanks for subscribing!
This email has been registered!
Take 20% off your first order
Enter the code below at checkout to get 20% off your first order